4510.0 - Recorded Crime - Victims, Australia, 2016
ARCHIVED ISSUE Released at 11:30 AM (CANBERRA TIME) 06/07/2017
Page tools:
 Print Page Print Page
 Print All Print All
| ||
VICTIMS OF CRIME, AUSTRALIA This chapter presents national statistics about incidents of victimisation for a selected range of offences that were recorded by state and territory police during the period 1 January to 31 December, 2016. National data about victims of Assault are unavailable as statistics about these offences are not published for Victoria and Queensland (see Explanatory Notes paragraphs 60–63). A victim may be a person, premises, organisation or motor vehicle depending on the offence type (see Explanatory Notes paragraphs 13–14). NATIONAL OVERVIEW The number of victims recorded by police nationally increased across all selected offence categories between 2015 and 2016. The largest increases (9%) occurred for Motor vehicle theft and Homicide and related offences, up 4,561 and 36 victims respectively. (Table 1) Between 2015 and 2016, the number of victims of Sexual assault and Robbery offences increased by 5% (up 1,104 and 435 victims respectively); as did victims of Other theft offences (up 5% or 27,634 victims) who accounted for the majority of victims recorded by police nationally in 2016. (Table 1) 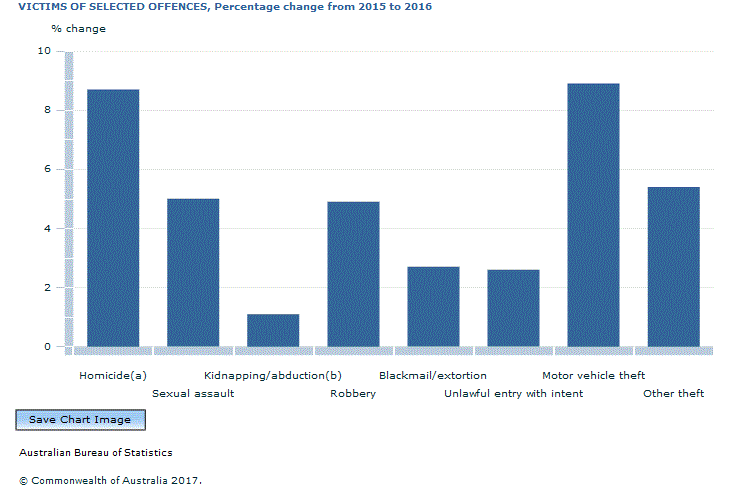 Footnote(s): (a) Homicide and related offences includes Murder, Attempted murder and Manslaughter. Excludes driving causing death. (b) Counts for New South Wales may be slightly inflated (see Explanatory Notes paragraph 77). Source(s): Recorded Crime - Victims HOMICIDE AND RELATED OFFENCES The number of Homicide victims rose from 416 victims in 2015 to 452 victims in 2016. The increase was driven by a rise in the number of victims of Attempted murder (up 41 victims). (Table 1) Murder Across Australia, the number of victims of Murder decreased by 4% between 2015 and 2016, from 236 to 227 victims. Almost two-thirds (65%) of all Murder victims recorded in 2016 were male (147 victims) and 41% of male Murder victims were aged between 35 and 54 years (60 victims). There were 80 female victims of Murder recorded in 2016, 31% of these were aged between 20 and 34 years (25 victims). (Tables 1 & 2) In 2016, Murder was most likely to have been committed at a residential location (67% or 153 victims). (Table 3) A weapon was used in 69% of Murders (157 victims). A knife was twice as likely to have been recorded as the murder weapon (71 victims), when compared to a firearm (32 victims). (Table 4) Attempted murder The number of victims of Attempted murder in Australia increased by 27% between 2015 and 2016, from 155 to 196 victims. (Table 1) Persons aged between 20 and 34 years comprised 36% of Attempted murder victims in 2016 (71 victims), 35% of victims were aged between 35 and 54 years (68 victims). Three out of five victims (60%) of Attempted murder were male (118 victims), which was consistent with the previous year. (Table 2) 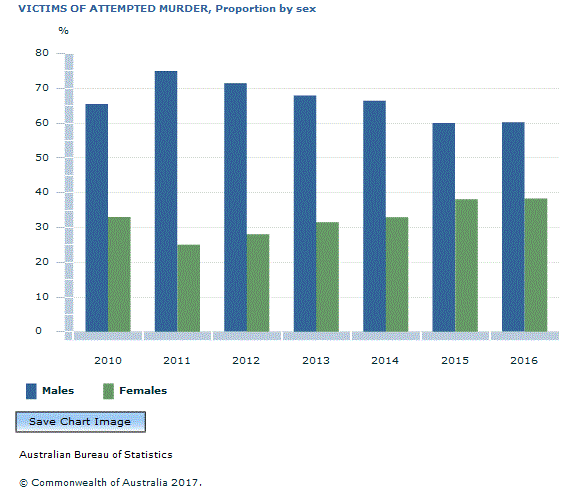 Source(s): Recorded Crime - Victims SEXUAL ASSAULT There were 23,052 victims of Sexual assault recorded in Australia in 2016, equating to 1 victim of Sexual assault per 1,000 persons. This was the fifth consecutive year, in which, the number of Sexual assault victims have increased, up 24% since 2011 (4,436 victims). (Table 1) 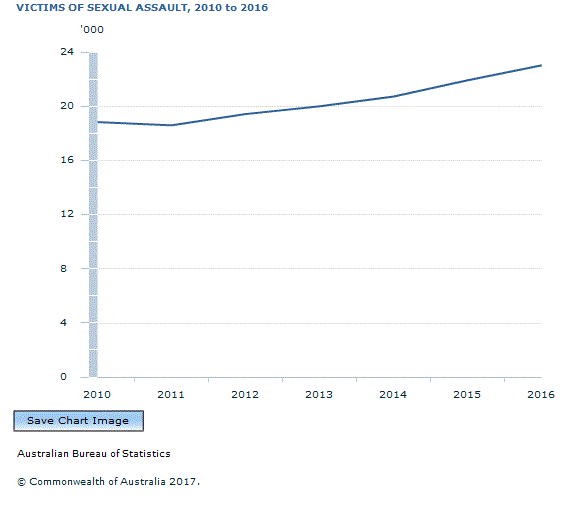 Source(s): Recorded Crime - Victims In 2016, four out of five victims of Sexual assault were female (18,861 victims). A quarter of female Sexual assault victims were aged between 15 and 19 years (4,792 victims). Females in this age group had the highest victimisation rate at 662 victims per 100,000 females aged 15 to 19 years. Of the 4,110 male victims of Sexual assault recorded over the same period, a quarter, were aged between 0 and 9 years (1,044 victims). However, males aged between 10 and 14 years had the highest victimisation rate at 112 victims of Sexual assault per 100,000 males in this age group. (Table 2)  by sex and age group, 2016.GIF) Footnote(s): (a) Rate per 100,000 persons for the sex and age group of interest (see Explanatory Notes paragraphs 31-33). (b) Includes victims for whom sex was not specified. Source(s): Recorded Crime - Victims In 2016, 67% of all Sexual assaults occurred at a residential location (15,351 victims), mostly a private dwelling (14,170 victims). (Table 3) The use of a weapon in the commission of the offence was recorded for 5% of Sexual assaults in 2016 (1,027 victims). (Table 4) ROBBERY The number of Robbery victims rose by 5% in 2016, from 8,968 victims in 2015, to 9,403 victims. In 53% of Robberies, the offender(s) was armed (4,985 victims). A knife was three times more likely to have been used in an Armed robbery (2,074 victims) than a firearm (641 victims). (Tables 1 & 4) UNLAWFUL ENTRY WITH INTENT In 2016, there were 188,756 victims of Unlawful entry with intent, a rise of 3% on the previous year (up 4,749 victims). Around two-thirds (67%) of these victims had property stolen during the incident (125,901 victims). (Table 1) Unlawful entry with intent most commonly occurred at a residential location, accounting for around 70% of victims across all years since the beginning of the time series in 2010. In 2016, around one in ten (11%) break-ins took place at a retail location (20,902). (Table 3) MOTOR VEHICLE THEFT The number of Motor vehicle thefts rose by 4,561 victims in 2016 to reach their highest levels since 2012, up from 51,525 victims in 2015, to 56,086 victims. This was the second consecutive increase in the number of victims of Motor vehicle theft nationally. (Table 1) 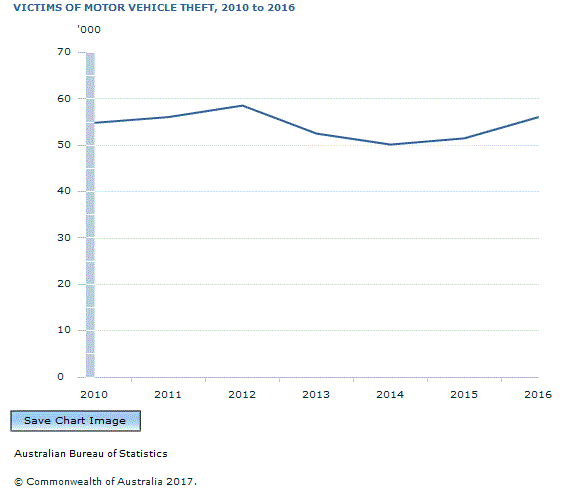 Source(s): Recorded Crime - Victims Half of the 56,086 Motor vehicles that were stolen in 2016 were taken from a residential location (27,841 victims). A street or footpath was the second most commonly reported location for stolen motor vehicles (27% or 15,085 victims). Around 6% of Motor vehicle thefts occurred from a retail or transport location (3,427 victims and 3,597 victims respectively). (Table 3) OTHER THEFT The number of victims of Other theft offences (which include the unauthorised taking or use of goods and services from a person, premises or motor vehicle) rose by 5% in 2016, up from 509,649 victims in 2015 to 537,283 victims. This is the highest number of victims recorded nationally over the seven year time series. Around a third of these thefts (34%) occurred from a retail location (182,480 victims), one in five (20%) occurred from an outbuilding, or residential land (107,857 victims). (Tables 1 & 3) Document Selection These documents will be presented in a new window.
|
||
